
The State of the Lighting Industry in Russia in 2023
Introduction
The lighting industry in Russia has undergone significant changes in recent years, driven by advancements in technology, changing consumer preferences, and government initiatives aimed at energy efficiency and sustainability. As we delve into 2023, it is essential to examine the current state of the lighting industry in Russia, including trends, challenges, and opportunities that are shaping its trajectory.
1. Technological Advancements
One of the most noticeable trends in the Russian lighting industry in 2023 is the rapid adoption of advanced lighting technologies. LED lighting, in particular, has gained immense popularity due to its energy efficiency and long lifespan. The demand for smart lighting solutions has also surged, with consumers and businesses seeking more control and customization options.
Smart lighting systems, which can be controlled remotely through smartphones or voice commands, are now widely available in the Russian market. These systems offer not only convenience but also the potential for significant energy savings by adjusting light levels based on occupancy and natural light conditions.
Furthermore, the integration of Internet of Things (IoT) technology with lighting systems is becoming increasingly prevalent. This allows for better energy management and opens up opportunities for data-driven insights into lighting usage.
2. Energy Efficiency and Sustainability
Russia, like many other countries, has been focusing on improving energy efficiency and sustainability in various sectors, including lighting. In 2023, the government continues to promote energy-saving lighting solutions through incentives and regulations.
The implementation of energy efficiency standards has led to the phasing out of incandescent bulbs in favor of more energy-efficient options like LEDs. This shift not only reduces energy consumption but also lowers greenhouse gas emissions.
Sustainability is also a growing conce
The Russian government has made several initiatives to increase energy efficiency in the lighting industry. This includes regulations that require a certain ratio of LED products that must be applied in national or city construction projects.
DongGuan Wonled lighting Co., Ltd. is a professional designer and manufacturer of indoor lighting fixtures established in 2008. Our finished products are mainly exported to the markets of Europe and America. We are a subsidiary company of Dong Guan Wan Ming Industry Co., Ltd.
Our mother company Wan Ming was established in 1995 and is a professional producer of metal parts in lighting industry. Products concentrated in Aluminum and Zinc alloy die- casting, metal tubes, flexible tubes and related accessories. Recenty, Wan Ming Group already become one of the key producer of metal parts in lighting field with around 800 staffs/workers and supplying parts for well-known customers like IKEA, PHILIPS and WALMART.
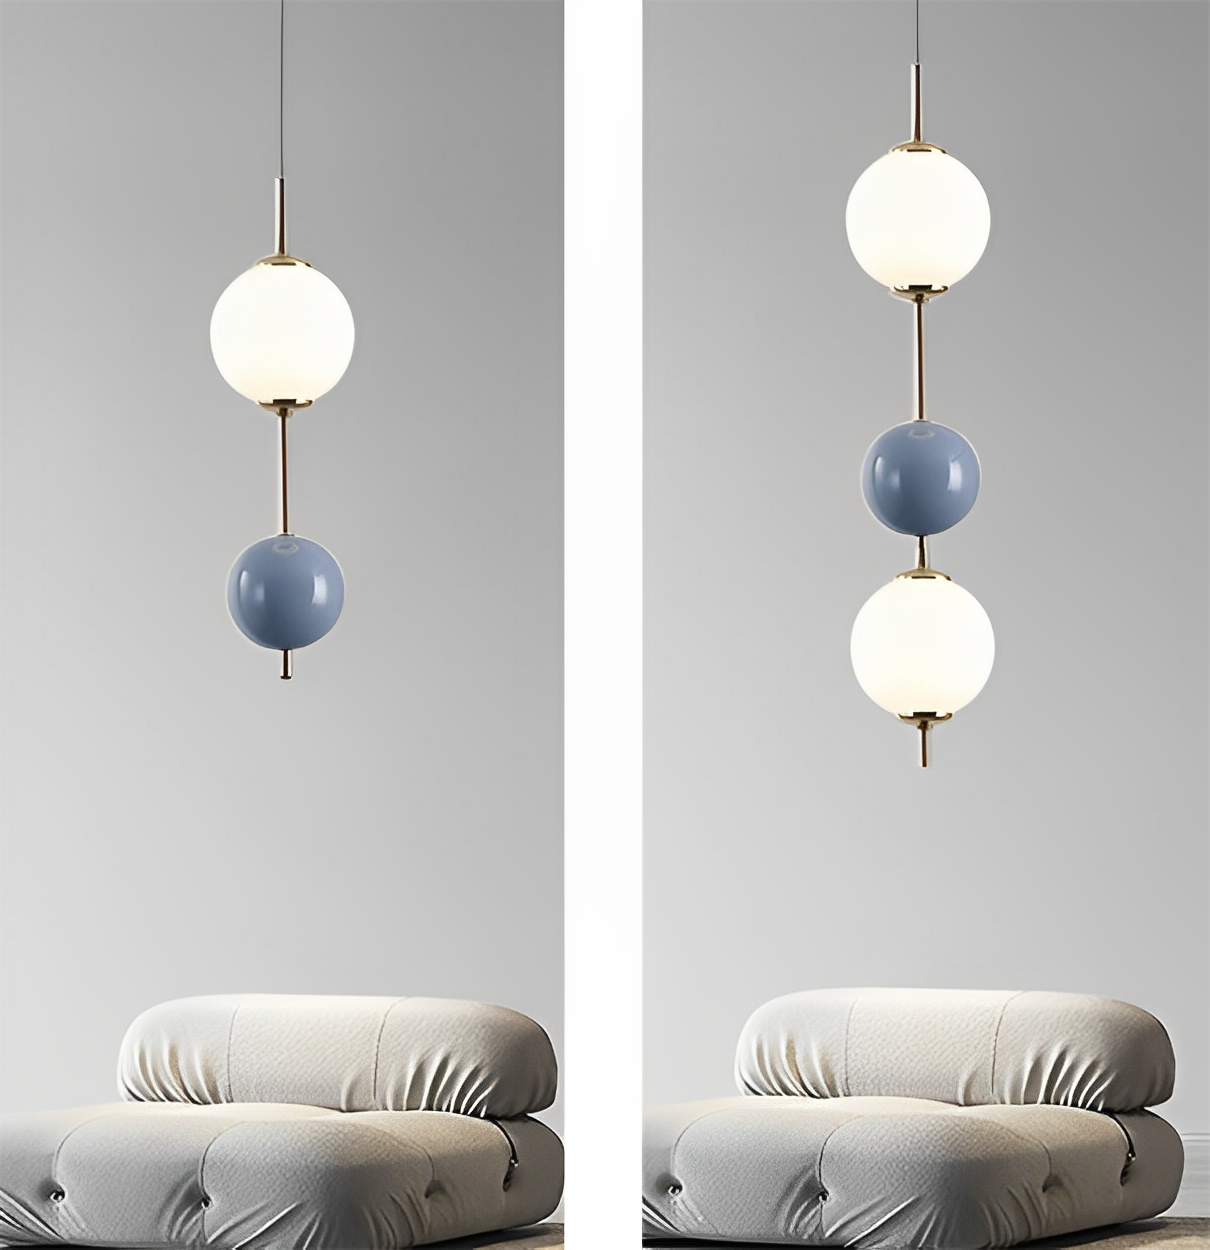
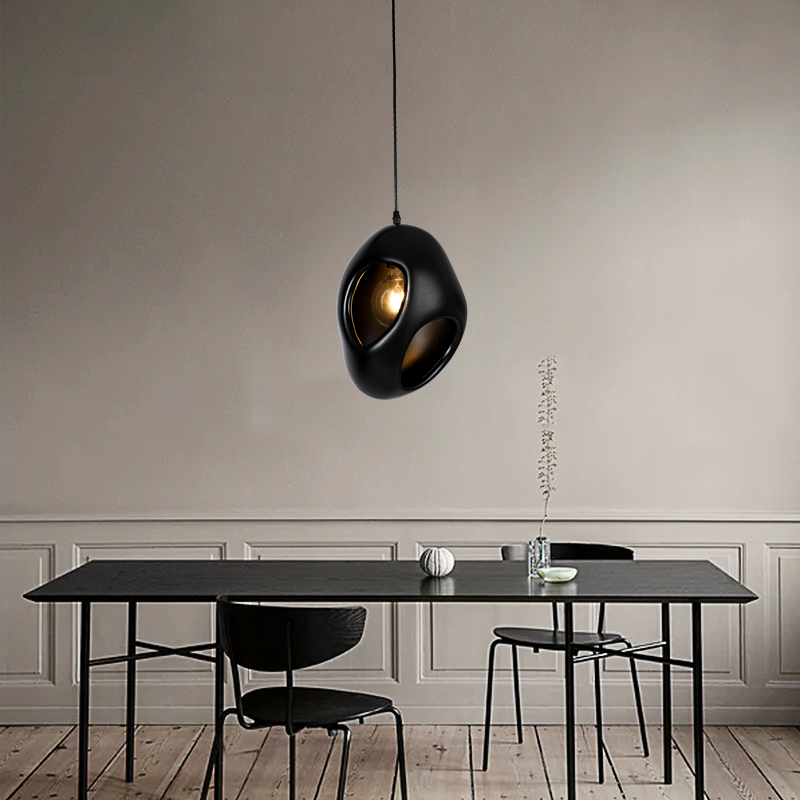
Wonledlight Exhibition showcases products
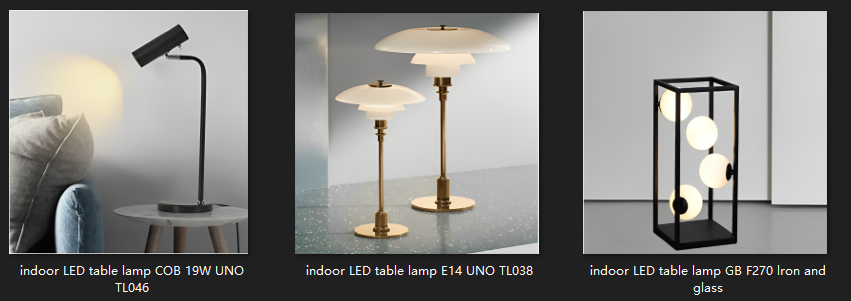
Products:
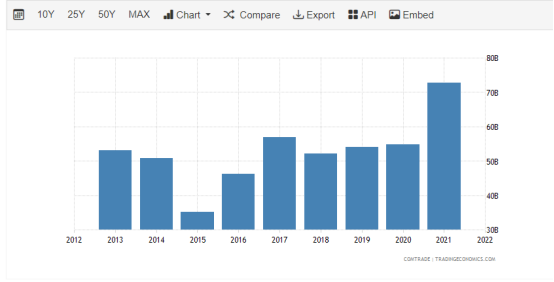
Russia Imports from China
Russia Imports from China was US$72.69 Billion during 2021, according to the United Nations COMTRADE database on international trade. Russia Imports from China - data, historical chart and statistics - was last updated on September of 2023.
| Russia | Last | Previous | Highest | Lowest |
| Balance of Trade | 8411.00 | 11027.00 | 37693.00 | -203.00 |
| Current Account | 8600.00 | 14786.00 | 76700.00 | -3774.00 |
| Current Account to GDP | 10.30 | 6.80 | 18.00 | -1.40 |
| Imports | 25020.00 | 26037.00 | 32481.00 | 2525.00 |
| Exports | 33431.00 | 37064.00 | 57904.00 | 4100.00 |
| External Debt | 347.70 | 354.80 | 732.80 | 151.30 |
| Capital Flows | 13060.81 | 37630.35 | 78249.45 | -47789.81 |
| Gold Reserves | 2329.63 | 2326.52 | 2329.63 | 343.41 |
| Crude Oil Production | 10077.00 | 10177.00 | 11051.00 | 5707.00 |
| Remittances | 610.00 | 600.00 | 740.00 | 44.00 |
| Oil Exports | 32794.00 | 30245.00 | 49413.00 | 5303.00 |
| Terrorism Index | 4.22 | 4.68 | 7.55 | 4.22 |
| Weapons Sales | 2820.00 | 2857.00 | 8679.00 | 1468.00 |
| Foreign Direct Investment | 13120.00 | 15992.00 | 40140.00 | -3922.00 |